Who is Immigrating to Canada? Skilled Workers

Who is Coming to Canada?
In 2013, Citizenship and Immigration Canada (CIC) instituted the requirement that applicants to the Foreign Skilled Workers Program (FSWP) had to submit an Educational Credential Assessment (ECA) as part of their application. At World Education Services (WES) they found that credential assessments for overseas clients increased from 16% of total assessments in 2012 to 80% of total assessments in 2014. That’s a more than four-fold increase in just 2 years.
Around the world, prospective immigrants to Canada want to know how their educational credentials measure up against Canadian standards. But just as importantly, this international pool of potential new Canadians – overseas CIC-ECA applicants specifically – have needs and aspirations that must be better understood to ensure Canada designs effective immigration policies with successful outcomes for new Canadians. WES – a CIC-designated provider of educational credential assessments – has done a survey of precisely these overseas applicants who have submitted an ECA. Here’s what they found:
Who are Canada’s prospective skilled worker immigrants?
In response to the changes in the FSWP, especially the new points system under Express Entry, the profile of overseas applicants appears to be changing.
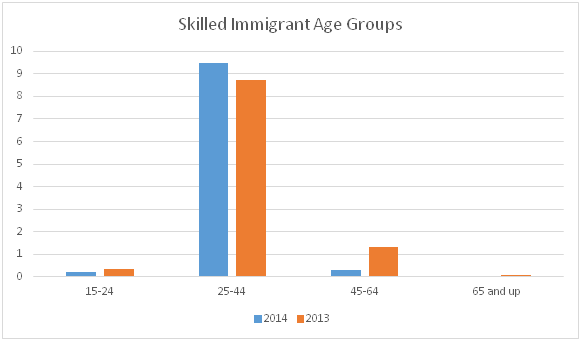
They are younger as the following bar chart shows:
- The 15-24 age group fell from 3.3 % to 2% from 2013 to 2014;
- The 25-44 age group rose from 83.7% to almost 95% over the same period;
- The 45-64 age group fell noticeably from nearly 13% to 3%;
- The 65 and over age group fell from an already low level of 0.13% to 0%.
They are mobile as the following table shows:
| Top 5 Countries by Citizenship | Top 5 Countries by Residence |
|---|---|
| India – 33% | India – 26% |
| Philippines – 16% | Philippines – 12% |
| China – 6% | United Arab Emirates – 6% |
| Nigeria and Iran – both 6% | Canada – 6% |
| Pakistan – 5% | China – 6% |
While India and Philippines occupy the top 2 spots in both charts one can see that the UAE is home to a lot of non-citizens, many from India and Pakistan, who are interested in migrating to Canada. As well, fewer Nigerian and Iranian citizens responding to the survey are still residents of their home countries. Further, 10% of all survey respondents had lived in Canada before: 45% as international students and 28% as Temporary Foreign Workers. That is, 4.5% of all respondents had lived in Canada as international students and 2.8% had lived in Canada as Temporary Foreign Workers. This shows that potential Foreign Skilled Worker applicants are mobile and willing to relocate in search of a better quality of life.
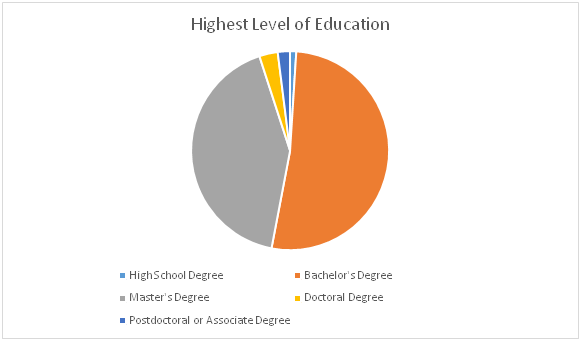
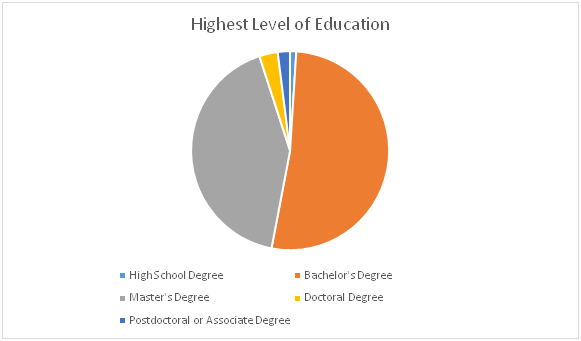
They are well-educated as the following chart shows:
In 2014, only 1% had only a high school degree while 52% had a bachelor’s degree and 42% had a master’s degree. 3% had a doctoral degree while 1% each had an associate degree or post-doctoral degree. In 2012, 28% of applicants had only a high school degree, while 34% had a bachelor’s degree and 18% a master’s degree. Clearly standards have become more rigorous in the last couple of years, and it appears that applicants are self-selecting and only applying if they have post-secondary education, as in 99% of cases in this survey.
They will or, want to, work in leading-edge sectors of the economy:
| Top Professional Categories | %age who will be working or have applied to work in each top category listed |
|---|---|
| Registered and Registered Psychiatric Nurses | 6.7% |
| Software Engineers and Designers | 6% |
| Computer Programmers | 5.5% |
| Interactive Media Developers | 5.5% |
| Information Systems Analysts | 5.5% |
| Consultants | 5.5% |
| Financial and Investment Analysts | 5.5% |
| Civil Engineers | 4.5% |
| University Professors and Lecturers | 4% |
| Physiotherapists | 4% |
Healthcare, Technology, Media, Finance, Engineering, and Academia: it reads like a STEM – Science Technology, Engineering and Math – recruitment poster. These are high-value-added sectors or vital professions like nursing. The challenge is how to help new Canadians acquire the experience and professional standards or licenses to enable them to find work in their chosen area. By giving so much weight in their points system to those with a job offer, Express Entry is taking a step in that direction. Their focus needs to be enhanced with support programs for new Canadians to help them adapt.
They have work experience:
| Years of work experience in their field | Percentage of total respondents |
|---|---|
| No professional work experience | 1% |
| 2 years of professional work experience | 7% |
| 3 – 5 years of professional work experience | 33% |
| 6 – 8 years of professional work experience | 27% |
| More than 9 years | 32% |
These are striking results. Almost 60 % of respondents have 6 or more years of work experience and nearly 1/3 have more than 9 years. Those with 0 to 2 years of experience only account for 8 % of applicants. Again, applicants realize that job experience is key in the Express Entry points system. Not only that, 88 % of respondents said they work full-time and only 5 % stated that they were unemployed. 3 % work part-time and 3 % indicated they were studying.
They are middle-class:
| Respondent’s Social Class | Percentage of total |
|---|---|
| Lower Middle-Class | 6% |
| Middle-Class | 50% |
| Upper Middle-Class | 35% |
| Upper-Class | 3% |
In other words, the respondents come from a relatively well-off, middle class background with almost all enjoying full-employment.
Why Do They Want to Come to Canada?
The motivators for migrating to Canada are several and are often economic:
| Top Motivations for Migrating | Percentage of Respondents |
|---|---|
| Better Standard of Living | 89% |
| Better Careers and Opportunities | 70% |
| Better Educational Opportunities | 49% |
| Political Stability and Freedom | 31% |
| Better Salary | 23% |
| Family Circumstances | 9% |
| Other | 4% |
Jobs, income, and careers are top priorities but education and political stability rank relatively high as well. Note that respondents listed more than 1 motivation so totals are more than 100%.
What do they expect from Canada?
While very positive about what they will achieve in Canada, the respondents were also fairly realistic about the barriers or challenges they would face.
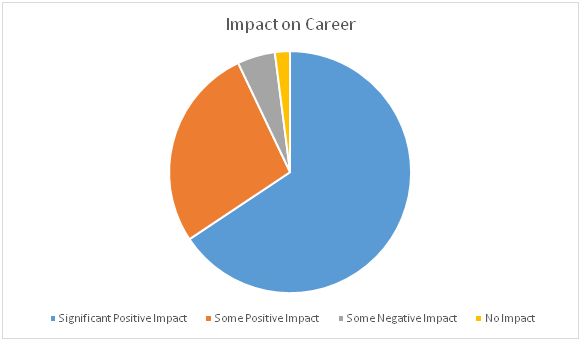
What impact would a move to Canada have on their careers?
The expectations of respondents are extremely positive: 65% expect a move to Canada to have a significant positive impact on their careers; 27% expect some positive impact; 3% expect some negative impact; and 2% expect no impact. That means that 92% expect a positive impact of some sort on their careers.
As to how long it would take them to find work in their field, the results are fairly optimistic as well:
| Years to Find Job in Field | Percentage of Respondents |
|---|---|
| Within 1 year | 59% |
| 1 – 3 years | 20% |
| Not sure/More than 3 years | 21% |
What challenges/barriers did prospective immigrants perceive?
When asked to list 3 barriers they may encounter in Canada, respondents answered as follows:
| Perceived Barriers in Canada | % of Respondents |
|---|---|
| Not enough work experience in Canada | 59% |
| Lack of information about jobs | 34% |
| Lack of licensure or foreign license not recognized | 34% |
| Not applicable | 26% |
| Foreign Education not Recognized | 23% |
| Discrimination | 15% |
| Insufficient Language Skills | 11% |
| Not enough education/training | 7% |
Because respondents were asked to list 3 barriers, the totals in the table add to more than 100%. Attitudes depended on the country of citizenship of the respondent as well. For example, 26% of Chinese respondents had a negative view of their job prospects in Canada while only 1% of Indian respondents had a negative view. Filipino respondents were nearly as optimistic with only 2% holding a negative view of their career prospects in Canada. Overall, 5% of respondents were negative on future career prospects in Canada. Further, 59% of Filipino respondents listed ‘lack of licensure’ as their main obstacle to job success, while 75% of Chinese listed ‘lack of work experience in Canada’ as their main obstacle.
Where Do Prospective Immigrants Want to Settle?
| Intended Destination 2014 Survey | Actual Destination – Economic Category 2013 |
|---|---|
| Ontario – 47% | Ontario – 32% |
| Alberta – 22% | Quebec – 23% |
| British Columbia – 12% | Alberta – 15% |
| Unsure – 7% | British Columbia – 13% |
| Nova Scotia – 4% | Manitoba – 6% |
| Manitoba – 2% | Nova Scotia – 1% |
| Quebec – 2% | New Brunswick – 1% |
| Saskatchewan – 2% | N/A |
This clearly shows that intentions do not always match reality and that immigrants need to consider alternative destinations in Canada in which to settle, like Manitoba for example.
Which kinds of support do prospective immigrants want?
| Desired Services and Support Upon Arrival | Percentage of Respondents |
|---|---|
| Job Placement | 67% |
| Professional Networking Opportunities | 63% |
| Employment Counselling | 62% |
| Government Career Accreditation | 45% |
| Getting a Canadian Professional License | 23% |
| Educational Counselling Services | 15% |
| Language Assessment Training | 9% |
How are their plans and immigration processes proceeding?
- 48% of survey respondents had applied to the FSWP and were awaiting a response;
- 36% of respondents were preparing applications to the FSWP;
- 9% of respondents had been accepted by the FSWP;
- 2% of respondents had been rejected by the FSWP;
- 62% had applied to the FSWP on their own;
- 28% had used an agent to apply;
- 8% had used a lawyer to apply;
- 3% had used a combination of family, friends, and other consultants;
- 7% had applied to another country besides Canada: over half of them to Australia; about a quarter to the USA; 13% to New Zealand; and about 10% to the UK.
Summing up, Foreign Skilled Workers who have submitted ECAs in order to apply to immigrate to Canada are a well-educated and experienced group of immigrants whose profile has changed remarkably in just a few years. The next step will be to monitor those who have migrated to Canada to see how successfully they are adapting to life in Canada and achieving their career goals. This will help provide support programs to assist new Canadians in successfully settling in Canada.


